Table of contents
- Introduction and Key Findings
- Online Learning & Delivery in 2021
- Accessibility in Higher-Ed: Exploring Challenges, Budgets and Accommodation
- Deep-Diving into Accessibility Technology Accommodations
- The Path to Access & Inclusion
- Exploring Accessibility Technology Usage & Shortcomings
- Survey Demographics
Introduction and Key Findings
Introduction
To gain insights and help its higher education community best prepare for the Fall 2021 semester, Verbit’s leaders commissioned an extensive survey to explore findings for the new school year. The growth of hybrid learning was unprecedented due to COVID-19, but will hybrid formats continue? What learnings were uncovered on students’ evolving needs? What strides have been made in accessibility, and what challenges will education leaders continue to grapple with?
To gain a better understanding of accessibility in higher education and various learning environments which can make or break the student experience, Verbit’s survey analyzed the perspectives of 230+ respondents, including higher-ed professionals and students themselves. 100 full-time students in North America, the UK, and Australia with a noted disability were surveyed, as well as 132 professionals.
Respondents reported their perspectives on the state of accessibility, accommodations and inclusion efforts in today’s institutions. They offered insights on accessible materials and effective technologies that can aid in student retention, student engagement and overall academic success. Respondents cited tools and technologies currently being provided to students, insights on in-person, hybrid and fully online learning environments, existing pain points and challenges and the impact of effective access. The survey was completed by an independent firm, with responses collected between April – May 2021.
The survey results offer an enlightening look at the importance of accessibility for schools and students alike. The results showcase how universities and colleges respond to student access needs and the impact that creating inclusive environments can have. The report also showcases processes and inefficiencies which are still holding today’s universities back, with 34% of respondents saying their institutions are failing to offer accessible environments. Lack of budget, institutional buy-in and knowledge on how to use accessibility tools were cited as the three primary culprits.
The report elucidates how school leaders are finding ways to innovate to keep students engaged in new learning models. For example, the majority sourced incorporating more video elements as a key engagement method. This report offers education professionals key insights to address common challenges and make smart changes to inform and impact the next semester.
Key findings
1
Hybrid & Online Learning Delivery Will Continue
85% of professionals reported that their institutions are planning to remain fully online or enlist a hybrid model this fall. With 75% reporting an increase in their inclusion and accessibility efforts since COVID-19, the report indicates that the remote landscape can be more challenging for students who may have needed fewer accommodations while learning in-person. 54% of respondents cited student engagement as a leading challenge and top priority to address. While 97% of leaders said their institutions adhere to the ADA (American Disability Act), 69% believe that there is more that they can do technology-wise to accommodate students, thereby addressing the engagement challenge and other critical disability factors.
2
Web Conferencing Platforms Dominate the New Learning Experience
The vast majority (89%) of institutions are using web conferencing tools. Top platforms that power synchronous classes are Microsoft Teams (77%) and Zoom (62%) followed by Google Meet (57%). Wise institutional leaders are analyzing how to set these platforms up for student success and address accessibility needs within them.
3
Accessibility and Accommodations Currently Rely on Student Disclosure, Which Is Limited
Schools make the majority of accommodations when students directly ask for them, either when reporting a need for their classes, (46%) or when reporting a need for support with specific content, (41%). In 38% of schools, it is common practice to only offer accessibility services on request. However, while 72% of students report using accessibility technologies, 52% will not ask for them nor suggest shortcomings with the technology unless explicitly asked to do so. Institutional leaders can aim to better help their students by proactively providing accommodations when they can to more students, rather than only those who report, as well as garner more consistent feedback for technologies which are already in place.
4
The Department of Student Services Has Greater Insight into Student Accessibility Needs
Student Services professionals showed the greatest level of knowledge around disabilities and access needs of students, with just 24% stating they struggle with accessibility awareness. In comparison, more than 40% of professionals in other departments – lecturers and professors, distance learning teams and even direct accessibility departments surveyed lacked such awareness. More internal collaboration with student services, which may be perceived to be a more comfortable environment for students to disclose their needs, will be fruitful.
5
Technology Isn’t “Nice-To-Have” – It Makes a Difference
92% of students see the positive impact of accessibility and accommodations on their learning and engagement. Students reported much fewer pain points with accessibility tools than their teachers report. For example, while 50% of staff reported the perception that accessibility tools require special skills to use, just 21% of students agreed. Since these technologies do make a substantial difference to learners, it’s likely that institutional leaders who do more to suppress faculty fears associated with using them and encourage more training will witness improved engagement, retention and success for their students.
Online Learning & Delivery in 2021
Expected Course Delivery for Fall 2021 and Platforms in Use
Faculty have had to quickly train themselves and reinvent their courses for digital-first environments. Currently, 72% of higher education professionals reported their university conducts its courses virtually or online (figure 1). While uncertainty continues due to the pandemic’s ripple effects, 85% of institutions are planning to offer classes fully online or in a hybrid format for Fall Semester 2021, split almost equally between those two options, at 44% and 41%, respectively (figure 2).

Figure 1. Percentage of Institutions’ Courses are Conducted Virtually or Online (Today).

Figure 2. Current Plan to Hold Classes for Fall Semester 2021.
Platforms Powering Synchronous Classes
Web conferencing platforms have been a key force driving the reinvented learning experience, offering a method to keep courses running and all stakeholders connected while remote. The vast majority (89%) of schools are using web conference tools. Top platforms reported to power synchronous classes are Microsoft Teams (77%), Zoom (62%) and Google Meet (57%). 11% of schools are using media hosting platforms, with Kaltura (13%) and Panopto (13%) serving as the most widely used.

Figure 3. Platforms Powering Synchronous Classes
Methods to Keep Students Engaged While Remote
Institutional leaders are actively seeking ways to ensure students remain engaged. The top method used for remote learning engagement is sharing videos to enhance lectures (93%). In addition, institutions are aiming to create greater opportunities for peer-to-peer engagement (86%) and using interactive technologies, including polling, chat forums and breakout rooms (80%). 79% are encouraging students to keep their web conferencing cameras on as well.
Overall, this has served as a period of testing for different student engagement methods. There has been greater adoption of Universal Design for Learning practices (20%) and interactive technologies (18%) to aid greater pools of students.

Figure 4. Methods to Keep Students More Engaged While Remote
Accessibility in Higher-Ed: Exploring Challenges, Budgets and Accommodation
Department Awareness of Accessibility Challenges
While engagement challenges appear to be top-of-mind, 24%-44% of survey respondents demonstrated a lack of knowledge or awareness of accessibility challenges. Responses showcasing a lack of knowledge (“Not sure”, “I don’t know”, “Not aware” etc.) for accessibility were gathered and grouped by department.
Departments generally expected to have a high level of awareness and knowledge, such as the Accessibility Department, also showcased a lack of knowledge in 42% of cases. Student Services showcased the greatest accessibility awareness, demonstrating one solution to this issue could be greater collaboration with more student-facing organizations when direct dialogue with students may lack in other parts of the university. Additionally, many students choose not to disclose their needs to the Accessibility Department (Page 13), which may indicate an additional source of this gap in awareness.

Figure 5. Lack of Awareness of Accessibility Challenges by Department
Student Disability Disclosure Metrics
Less than 50% of students are disclosing their disabilities, according to94% of survey respondents.Professors witness this issue more extensively than the IT departments do.
Additionally, while more than half of professors are aware of the fact that less than 5% of students are disclosing their disabilities, this number drops dramatically when considering IT’s viewpoint, a department which is likely to have greater separation from direct student dialogue.

Figure 6. Percentage of Students Disclosing a Disability

Figure 7. Percentage of Students Disclosing a Disability: IT vs. Professors
Accessibility Challenges and COVID-19’s Impact
Schools are currently reporting multiple challenges (figure 8), with over half (54%) indicating student engagement as their top challenge. Other leading challenges include student retention (42%) and the direct call out of accessibility (39%).
COVID-19 played an evident role, impacting inclusion and accessibility for 75% of schools (figure 9). 32% of respondents indicated it became top of mind at their institutions, while 43% reported it had some impact. With more courses expected to be delivered in online and hybrid formats even after COVID-19 subsides, the same challenges with remote environments and accessibility needs are likely to be considered and prioritized.

Figure 8. Current Challenges at Institutions

Figure 9. COVID Impact on Inclusion & Accessibility
Accessibility Budgets
Budgets were cited as a primary source of struggle in meeting new needs. The survey aimed to explore if budget management and distribution plays a role. The vast majority (78%) of schools are using a centralized budget for accessibility, while only 22% of schools are using a decentralized budget. However, respondents indicate a decentralized budget is more effective – 74% of those with decentralized budgets find it effective, compared to only 55% using centralized budgets.

Challenges in Accessibility Investment
The top challenges holding schools back from investment in accessibility are the lack of budget and/or resources (51%) and the lack of knowledge / awareness (38%).

Figure 11. Top Challenges Holding Schools Back from Investing More in Accessibility by Problem Category

Figure 12. Top Challenges Holding Schools Back from Investing More in Accessibility by Challenge
Technologies and Tools for Access
50% of schools are recording and transcribing lectures to aid in student accessibility needs. Other commonly offered accommodations include live captioning and transcription during lectures (44%) and notetakers (44%).
Far fewer institutions are offering translation or subtitles of classes, which could help with the engagement of international students and those learning in languages which are not native to them.

Figure 13. Technologies and Tools Used to Provide Access for Students
Pain Points in Transcription and Captioning Technologies
The No. 1 pain point for half the school leaders surveyed (50%) with regard to accessibility technologies is the requirement for special skills. Other pain points include that the technologies are complicated to use (43%) and that onboarding these technologies has a slow turnaround time (37%), which could translate to delays in providing access to students. An even greater gap is evidenced when breaking down the cited top challenge by department (figure 15). 72% of IT professionals noted that the lack of special skills is a problem, while this number drops to 26% for professors and lecturers, who may rely more on IT for challenge No. 1, but perceive other items as greater challenges themselves.
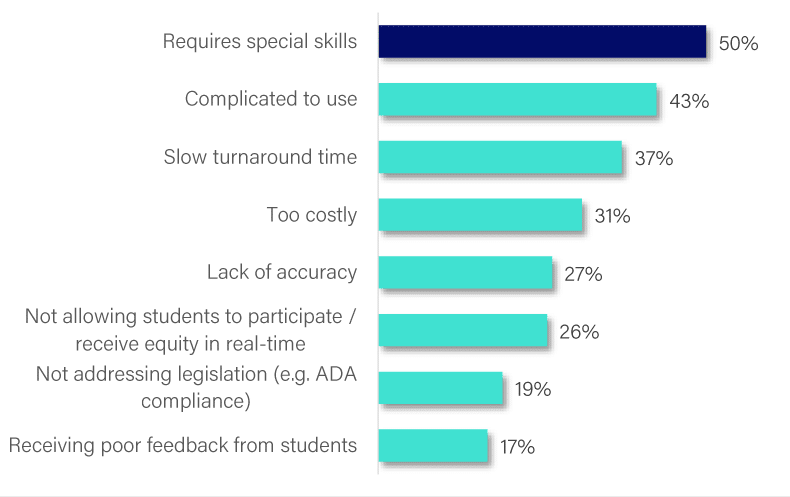
Figure 14. Top Pain Points in the Accessibility Technologies Currently Used
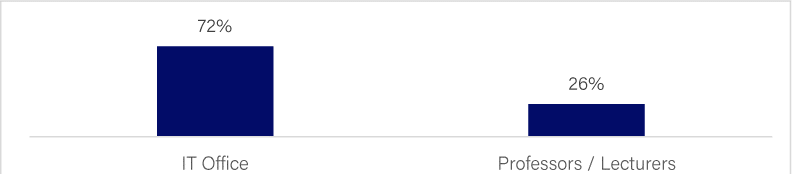
Figure 15. Top Pain Point (Requires Special skills) by Department
Deep-Diving into Accessibility Technology Accommodations
Accommodations in Digital Environments
46% of professionals reported that accommodations are considered when a student has a need for their classes and reports the need to the disability department. These numbers drop significantly when moving further outside of the classroom to other elements of the student experience, such as providing accessible sites, guest lectures and sporting events, indicating a less than inclusive experience for many students with disability needs. Institutional leaders could aim to analyze their processes for student requests and anonymity when possible to ensure equity for all students across various elements of the university experience.
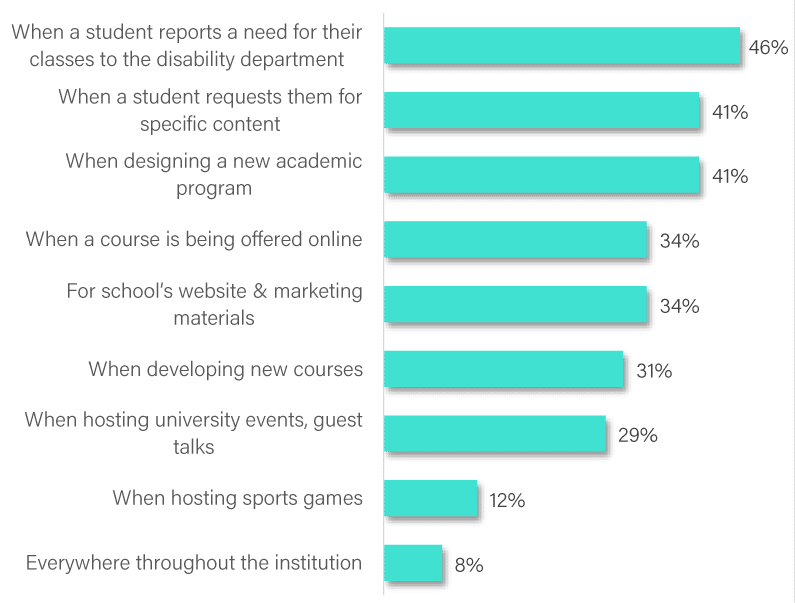
Figure 16. Timing of Accommodations for Digital Environments
Video Captioning Metrics
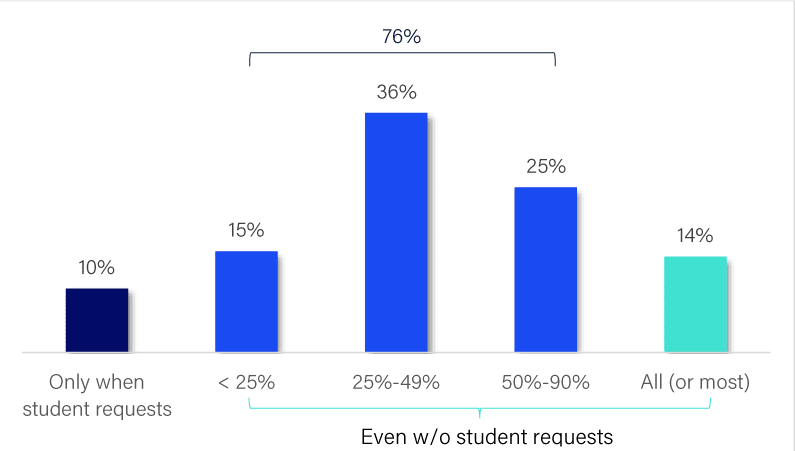
Figure 17. Percentage of Video Captioned
Captioning is commonly considered a key method to fuel access, particularly for students with disability needs. However, only 14% of schools report captioning all (or most) of their video content. 76% only caption partially and 10% only caption when a student specifically requests it.
Captions can benefit a multitude of students, regardless of needs such as hearing loss, but do not appear to be highly implemented or considered proactively as a top-of-mind initiative.
Availability of Course Accommodations
In over half of schools (57%), when accommodation services are provided to one student in a course, they are then made available to all students in the course. In 38% of schools, they are only made available to the students who request them.
With many students not reporting their disability needs, if access is already being granted to one student, university leaders could consider offering the captured transcript or offering captions to all students for greater access to a greater number of learners.

Figure 18. Availability of Accommodation Services in Courses
The Path to Access & Inclusion
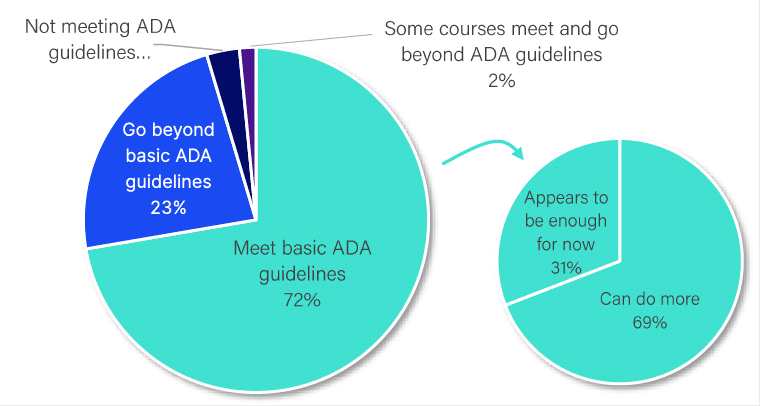
Figure 19. Percentage of Students Disclosing a Disability
97% of professionals surveyed say their institutions meet or go beyond ADA guidelines, but the majority (72%) meet basic ADA guidelines.
Only 31% of professionals at institutions that meet basic ADA guidelines believe it’s enough to serve students. Most of them (69%) report their institutions can do more. The majority of professionals do appear to want to offer more access to students to help them overcome existing barriers affecting their learning experiences.
Path to Access and Inclusion by Department and Course Delivery Format
When comparing how different departments view ADA guidelines (figure 20), a significant gap exists between professionals in the IT Office versus Lecturers. 31% of lecturers believe they are going beyond basic ADA guidelines, but only 8% of IT Office professionals note the same.
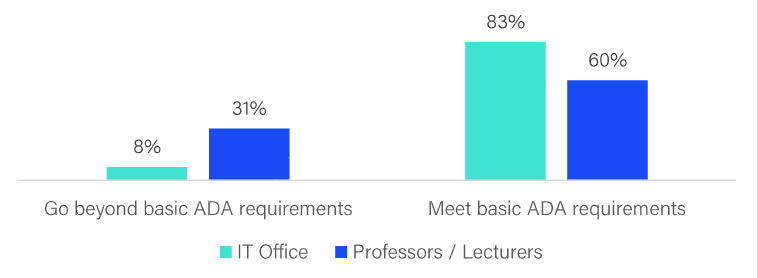
Figure 20. Path to Access and Inclusion – IT vs. Lecturers
When comparing the same questions for institutions which are fully online to those that are hybrid (figure 21), those that are fully online state they are going beyond the basic ADA guidelines, but only 13% of those that are hybrid, report the same.
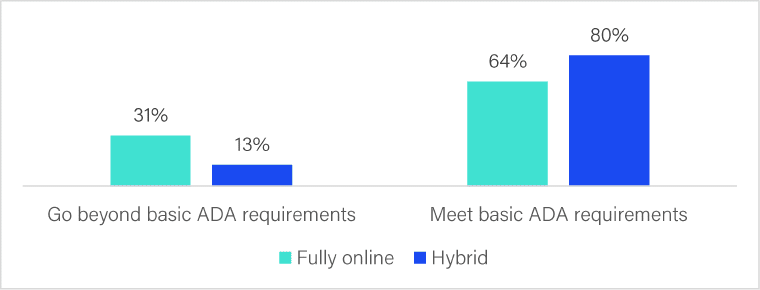
Figure 21. Path to Access and Inclusion – Fully Online vs. Hybrid
It appears that having an in-person component as well may hold institutions back from feeling the need to do more to surpass basic accommodation guidelines and proactively aim to offer more equity to students learning through hybrid means.
Institutions’ Commitments to Accessible Environments
Two-thirds of students say their institutions seem committed to creating an accessible environment. However, many schools appear to still be failing to meet the needs of their students.
Some institutions are missing the mark completely (13%) in serving their students. According to students with disabilities, 21% of institutions’ leaders think they are being accessible, but in reality, are falling short. It’s evident that higher-ed institutions can do more to meet their students’ needs effectively.
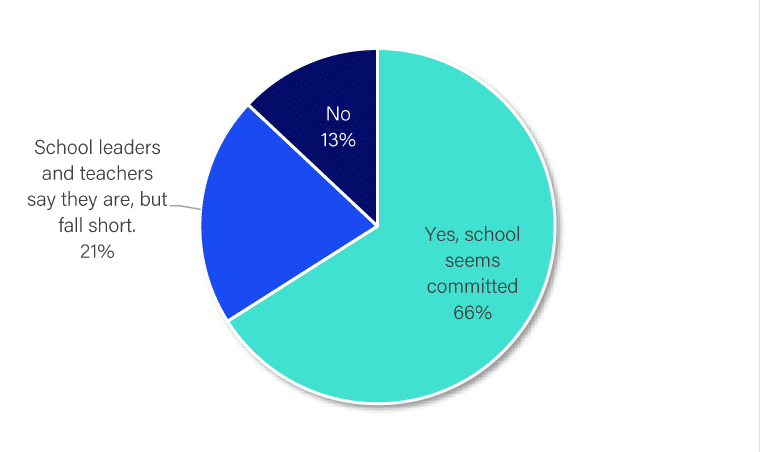
Figure 22. Do Institutions Appear to be Committed to Creating an Accessible Environment?
Exploring Accessibility Technology Usage & Shortcomings
Mapping Accessibility Technology Availability and Usage
According to students with disabilities themselves, captioning (37%), notetakers (32%) and sign language interpreters (29%) are the accessibility technologies available and used most frequently. It’s interesting to note the difference between usage and availability. Even when accessibility technologies are available in all courses, they are not necessarily always being used by students. Notably, when transcription is widely available in all courses, 32% of students with disabilities are not using it. This reality raises questions of if the transcription being offered is inaccurate or ineffective, or if students do not recognize its value to them.
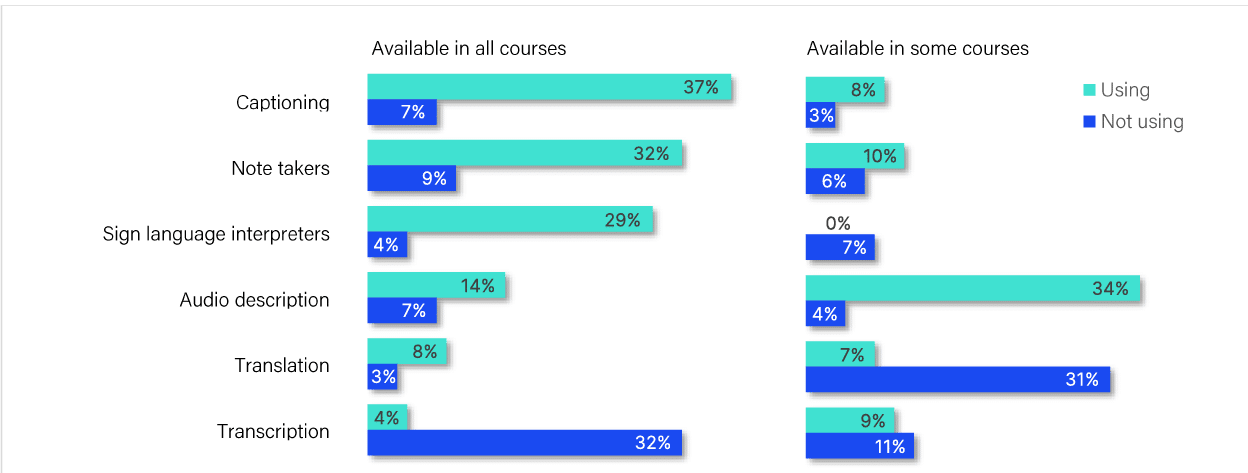
Figure 23. Mapping Accessibility Technology Availability and Usage
Accessibility Technology, Usage, Pain Points and Shortcomings
74% of students (figure 23), report that the usage of tools that provide access impacts their learning and engagement. This number jumps to 92% when schools incorporate top-quality services and tools.
However, when ineffective tools are instituted or those are perceived to be more difficult to use, it can affect “buy-in” for their usage and impact. Significant gaps exist when comparing the pain points in using accessibility technologies between professionals and students (figure 23). While the challenge of requiring special skills is the No. 1 pain point outlined by professionals (50%), it is only cited as a pain point for 21% of students. A similar difference appears in the importance of special skills required as cited by lecturers compared to IT staff. Back-end staff appears to see an inflated need for expertise. Rather, the students’ top challenge is that tools are complicated to use (35%), which appears to also be of concern for 43% of professionals surveyed.

Figure 24. Pain Points in the Accessibility Technologies Currently Using – Students vs. Professionals

Figure 25. Access to Tools Reported as Making a Difference in Learning and Engagement
Usage of Accessibility Technologies and Shortcomings
72% of students with disabilities are using accessibility technologies. However, many students do not report their needs. They are split nearly in half in terms of whether will ask for technology services or report their shortcomings. This lack of reporting and transparency is critical to consider when aiming to craft inclusive classrooms and environments, as it’s likely to continue to emerge as an issue should school leaders not proactively address or offer such accommodations to the greater student population.
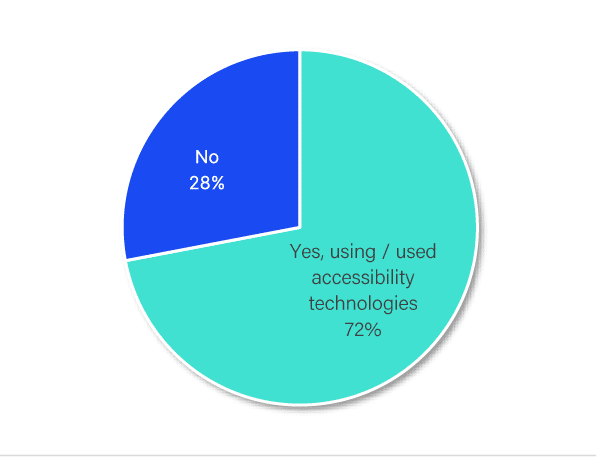
Figure 26. Using (or Used) Accessibility Technologies
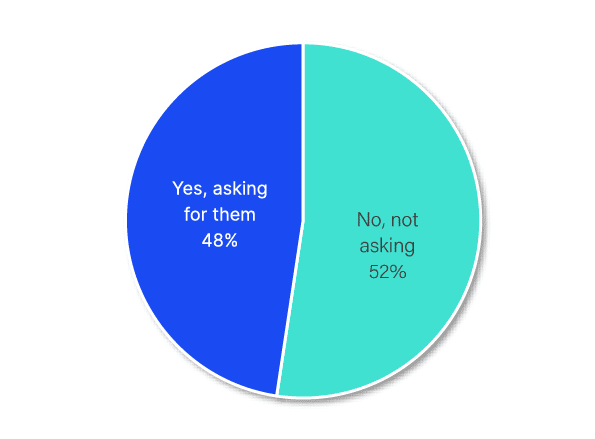
Figure 27. Asking for (or Reporting Shortcomings) When Services are not Offered
Survey Demographics
Job Role, Company Size and Industry
Details on the 100 full-time students with a noted disability who were surveyed across North America, the UK and Australia, as well as the 132 higher education professionals surveyed in those regions.
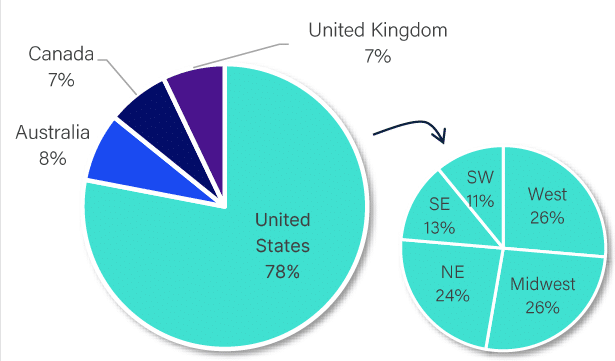
Figure 28. Staff – Location of Institution
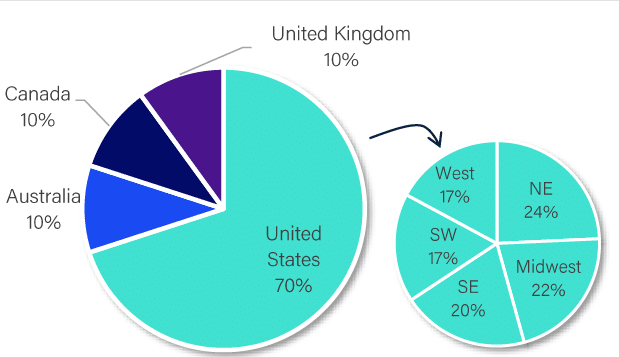
Figure 29. Students’ Institution Location
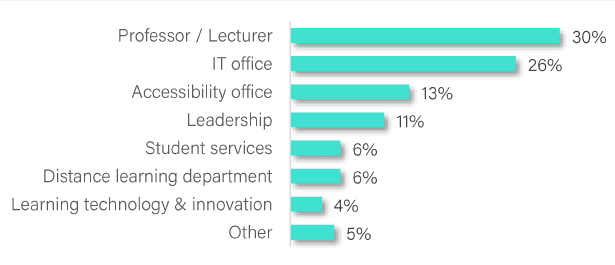
Figure 30. Staff – Role/Department
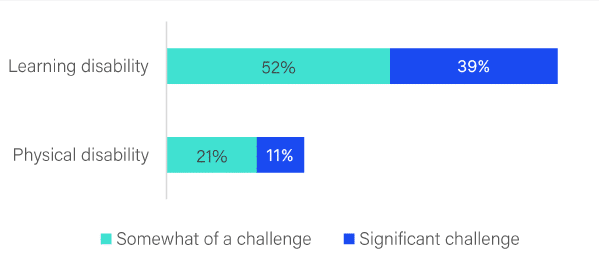
Figure 31. Students’ Disability Type
About Verbit
Verbit provides the world’s leading interactive transcription and captioning solution. It utilizes in-house, AI-based technology to transform both live and recorded video and audio into accurate captions and transcripts for the education industry. Verbit’s customizable solution helps customers, including K-12 schools and universities, adhere to ADA guidelines and drive accessibility and inclusion for all students and events. The company is based in New York, San Francisco, Tel Aviv, and Kyiv and has more than 30,000 transcribers and over 350 employees globally.
This survey was conducted by Global Surveyz, a global research company. Global Surveyz provides customers with a survey report as-a-service offering that covers the whole process of creating an insightful and impactful B2B or B2C survey report.